Today’s Training: Gale Digital Scholar Lab
Today’s Reflection Question:
- How would you feel about helping someone else learn how to use Gale Digital Scholar Lab? What did you find most interesting? What did you find most frustrating? What questions do you still have, and what parts of the tool do you want to explore more deeply?
In today’s training, I practiced running literary analysis techniques on multiple text files using Gale Digital Scholar Lab.
I created a ‘content set’ (set of literary text, or data used in the analysis) by uploading 2 .txt files that contain text of literary pieces (whose copyright I assume is expired). The first text file came from the training website (Melville’s Moby Dick). As I noticed some analysis required two or more texts to compare them, I uploaded another file of Romeo and Juliet by William Shakespeare, available via Project Gutenberg.
It was interesting that the tools allow users to select which words they want to ignore (words like ‘a’ or ‘and’ would be abundant and negatively affect the analysis of more important words), although I selected the default list of words. Overall, I was surprised by how quickly the entire analysis process took (less than 2 minutes to complete 8 different types of analysis).
Below are screenshots showing the results of each text analysis technique, and my reflection on each.
Document Clustering
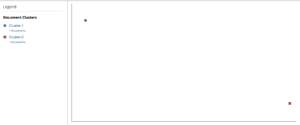
The graph shows Mody Dick (text no. 1) and Romeo and Juliet (text no.2 ) placed further away on the axis, almost on the opposite ends. While it was not obvious from this screen what the criteria for comparison was for determining similarity or difference, it was clear that the analysis concluded the two pieces were very different overall.
Named Entity Recognition
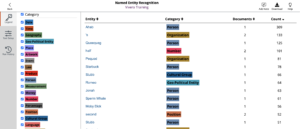
In this analysis, any named entities which are majority nouns, including names of places and characters.
The most frequent appearing noun (by count) was ‘Abab’, which is the name of a protagonist in Moby Dick. This tells us that he is a greatly significant character, as he is being referred to the most times than any other character.
I found it interesting how some words were processed under this analysis. For instance “‘s” (as in ‘This is Shakespeare‘s book’) was categorized as Organization, and ‘Romeo’ (the name of a character in Romeo and Juliet) as Geo-Political Entity likely due to its geographical connotations. This could be considered miscategorization as they may not fit into the context of literary analysis. This inconsistency in labeling in machine system could be an indication of the need for human checking and editing before and after running analysis using technology, as wrong categorization and data cleaning can lead to inaccurate conclusions.
Parts of Speech
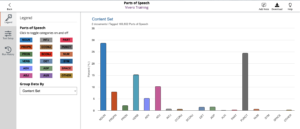
This analysis categorizes the words in the text into different grammatical functions. The graph shows that noun and punctuation were the most frequently appearing word categories, while pronouns and prepositions were less common.
I think that this analysis would be interesting when comparing texts from different time periods or styles, as it can tell us more about what kind of words consist of the work. To do this, reinforcing correct data cleaning and filtering of which words to analyze would be critical.
Sentiment Analysis
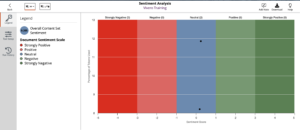
I was excited to see this analysis in one of the tools, as it would be interesting to compare how I (as a human reader) would describe the sentiment of the text as opposed to technology.
I was surprised that both texts were placed in the ‘Neutral’ category; I would think of Romeo and Juliet as a tragedy with intense emotions of love, passion, sadness, and anger. As we were comparing two texts, it was interesting that the two were placed in different places on the vertical axis. This indicates different number of ‘tokens’ were used for sentiment analysis, and I was not entirely sure what it meant before looking up (tokens refer to the broken-up pieces of text used for analysis).
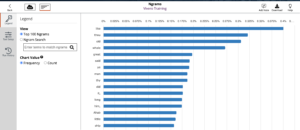
Ngrams
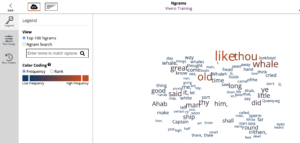
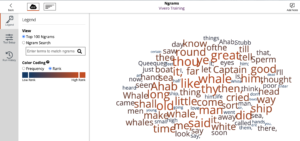
Ngrams create a visual representation of words that are used most frequently (image on the left), or with high rank (image on the right). At first, frequency and rank seemed like very similar concepts, which confused me as to why they produced very different images.
Through this, I learned the importance of knowing the right terminology, which is very similar to statistics. In this concept, frequency refers to the number of times certain words are mentioned in the text, while rank refers to how common the word is among all words. I learned that this is important to distinguish, as words that appear frequently in the text I analyze might not be of high rank in the overall library of English words.
After distinguishing those terms, I think that the visualizations are easy to comprehend, although the cluster of words may not be easy to comprehend. How words are organized and placed in relation to each other raises the question about this complex representation.
Topic Modeling
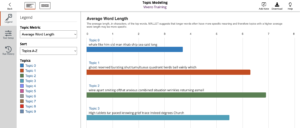
Topic Modeling was the type of analysis that was perhaps the hardest to comprehend without the definition provided by the training. This categorizes the words into different ‘topic’ by placing words that are likely to appear next or close to each other in the same topic.
For instance, looking at Topic 0 (the first line in the graph, in blue0 tells that the word Ahav (name of character) is likely to appear next to or close to words such as “whale”, “old”, “sea”, and “long”.
This can be an interesting tool to analyze the relationship or meaning of some words by analyzing the relationship between the word and the words surrounding it. This also stressed the importance of the person analyzing understanding the language they analyze in, and that they are familiar with the ext before running analysis.
To answer today’s reflection question:
- How would you feel about helping someone else learn how to use Gale Digital Scholar Lab? What did you find most interesting? What did you find most frustrating? What questions do you still have, and what parts of the tool do you want to explore more deeply?
I think that going through the training to learn this tool was helpful in understanding the basic types of analysis one can run using Gale Digital Scholar Lab. I found it most interesting that there was a lot of difference between the results I expected and the actual results, which highlights the difference between how humans analyze texts using our own language skills and experience, and how technology does it from data.
I found it somewhat frustrating when the methods and categorization in some analyses were unclear. I hope to better understand the methodologies to understand how each analysis is done, and how I can customize to fit my own research question and purposes. I am also interested in thinking about what kinds of texts to analyze. I am interested in analyzing different types of texts (for instance, a news reporting text and a scientific journal), and would like to know ways to effectively analyze different types of texts, and the kinds of modifications I might need to make to do that.